The Toolbox is the main operational point for accessing functions for the Tabulate app. It typically appears at the left-hand side of the canvas (for LTR languages). The Toolbox provides access to the same functions, regardless of the currently selected tab ribbon.
Note: The Toolbox is sometimes referred to as the Canvas Menu.
Tabulate Lite Toolbox
The Toolbox appears as follows:
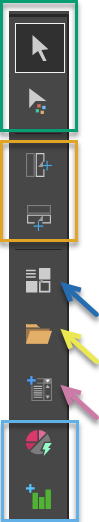
Selection Tools
The selection options (green highlight above) control what your cursor does when you select items on the canvas.
|
Function |
Description |
|---|---|
|
Default Selector |
Enables the selection of either a single cell, or, by dragging the cursor, multiple cells. |
|
Provides access to the formatting panel, a context sensitive panel that you can use to set formatting preferences for your visualization. |
Add Rows and Columns
The add rows and columns tools (orange highlight) allow you to add batches of columns and rows to your spreadsheet.
|
Function |
Description |
|---|---|
|
Opens the Add columns submenu, which you can use to add 5, 10, 20, or a custom number of columns to the end of your spreadsheet. |
|
|
Opens the Add rows submenu, which you can use to add 10, 50, 100, or a custom number of rows to the bottom of your spreadsheet. |
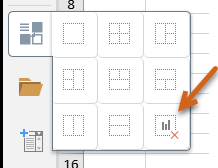
Screen divider options
The Screen Divider (blue arrow) divides the Tabulate Canvas into different arrangements:
- Right-click the menu item to open the submenu and choose the layout required to allow for one, two, three, or four visualizations.
Tip: You can also select the Remove Visuals item (brown arrow below) to restore the layout to the original state and removes any visuals.
Content Selector
Add existing discoveries to your tabulation from the content manager. These are shareable visuals that were created in Discover. This option opens an explorer-like interface, where you can select items that are saved in your private folder (My Content) or any Workgroup or Public folders you have access to. Note: You can also search for items by name or select them from your Recent and Favorite file locations.
- Click here to import discoveries into your tabulation
Add new slicer
The Add New Slicer button (purple arrow) allows you to add a Slicer to your canvas. Slicers are used to filter data visualizations in tabulations. If a content item contains a slicer, you can select a value from it to filter any visuals driven by it.
- Click here for more information about slicers in tabulations
Content items
The Add content item options (blue highlight) are used to create visuals on the fly and add them to this tabulation.
|
Function |
Description |
|---|---|
|
Helps non-technical users to build analytical content using augmentation engines and heuristics. |
|
|
Provides a streamlined interface where users can quickly analyze data on the fly, ensuring that report-building is intuitive and straightforward. |